
2 Jun 2008, 11:59PM PT
14 May 2008, 3:02PM PT
Closed: 2 Jun 2008, 11:59PM PT
Earn up to $500 for Insights on this case.
10 Insights


![]() How Do You Use Analytics Tools To Enhance Sales/Marketing? by Devin Moore
How Do You Use Analytics Tools To Enhance Sales/Marketing? by Devin Moore
Thursday, May 15th, 2008 @ 9:00AM
![]() How Do You Use Analytics Tools To Enhance Sales/Marketing? by David Mould
How Do You Use Analytics Tools To Enhance Sales/Marketing? by David Mould
Saturday, May 17th, 2008 @ 5:15PM
Working in telco I have found the most effective uses for analytics have been:
Lifetime value
Using analytics we have been able to assign a lifetime value to each customer. The value is created from 30 separate data points that identify how much each customer means to the business in terms of inbound revenue and maintenance costs.
Each product a member has across the enterprise, their usage pattern, credit history and potential to take up new products are all positive points towards their score.
The number of touch points are also calculated for example how many times a customer phones in, number of outbound calls, number of billing enquiries (all channels including IVR). Each touch point is a cost to the business.
The full picture of revenue in and spend out is then balanced to give the customer a score. This enables the business to manage decisions around:
By example:
A customer is 1 month from completing their 24 month contract. The business knows the following information from the data intelligence collated:
Now the front of house operation is better placed to make decisions on trying to retain the customer or not. Should a special plan be created for the customer (e.g. more GPRS versus SMS)?
Is the customer high maintenance, how often do they phone in or create a CSR to phone out, how quickly do they pay their bill?
When a new product is released is this customer a likely candidate for take up based on their spend pattern?
With this information to hand the business can decide if they should invest some time in reatining this customer or is it better to try and find a replacement customer.
Product Maintenance
Product maintenance intelligence provides insight on how effective a produt is in the market place and therefore if the product should be maintained or deprecated from the enterprise.
A product portfolio represents all of the products offered across the business. A product porfolio management system looks to make the time to market quicker and more efficient but crucially should also track the take up of that offering in the market place.
A good PPM solution will have analytics functionality that provides a management dashboard. The product management team will be able to see the time to market of the product that will allow them to measure their ability for first to market benefits. If a product or the underlying OSS/BSS platform is complex the time to market will be slower losing the potential for first strike sales (getting the iPhone to market and Mobile TV are good examples).
In addition dashboards will provide marketing valuable insight on how "successful" a product idea is. With hook into CRM the product can be measured on key dimensions:
The take up by customer segment could lead to a new segmentation plan being derived. The youth market might need to more granular and follow up targetted products created.
The revenue generated is a key performance indicator. The overall take up might be good so the market penetration is good but if the average reveune per user is low there might not be an advantage in continuing to offer the product.
Dashboards offer the ability to measure stickiness and ARPU that alows the business to balance the benefits off to make good decisions.
Workforce Management
Good analytics around workforce scheduling is key to a good customer experience. Having someone wait too long before speaking to a user or having the common selections for IVR buried too deep to be meaningful to the customer will lead to disatisfaction.
Good intelligence around how long a customer stays in CTI or how many drop out of IVR to speak to a CSR provide useful information on the number of CSRs required and the calling patterns of the customers.
Using data driven analytics we have been able to change the structure of the IVR to suit the customer segments. Combining with lifetime value we have been able to identify a customer base that was low revenue generating and high cost to maintain and subsequently outsourced the management of this segment to a low cost provider.
Combining with product maintenance we have been able to track spikes in customer calls with releases of new products and now have better control of scheduling to ensure there are enough CSRs to handle projected call volume.
The key for all of these is that it is an iterative process, an ongoing programme of work. The data is constantly reassessed and the interpretation rules reviewed to make the most efficient use of the data collated.
Data analytics should always be aligned to key performance indicators. If you can measure it you can manage it.
|
Amanda Seth Fri Sep 16 4:48am |
Workforce analytics help identify opportunities and risks and take key decisions for future. Workforce analytics software such as humanconcepts has made this task easier. http://www.humanconcepts.com/solutions/organizational-planning-for-wo rkforce-analytics.htm |
![]() How Do You Use Analytics Tools To Enhance Sales/Marketing? by Karl Gechlik
How Do You Use Analytics Tools To Enhance Sales/Marketing? by Karl Gechlik
Friday, May 23rd, 2008 @ 8:45AM
To start this discussion I should first define what Analytics is. According to Wikipedia Analytics is "the science of analysis".
Analytics is vital to any business participating in web activities. Being able to analyze how much traffic you are getting, where is it coming from and where are they are going helps evolve your business. Without analytics I would not be able to gage which ads are doing better then others and replace the slow performers with PROVEN successful ads. Analytics is just that analyzed statistics.
By using Google Analytics, a free service, I have found where the majority of my traffic comes from. This allows me to "cater to the majority". It lets me find trends such as what people are searching for and finding my site and what are the new hot topics I should be writing about to draw more traffic. Once you draw more traffic you can use your statistics on improving page views per visit. Looking at my numbers at any given time I can make adjustments or additions to my site watching for trends and hoping to push these numbers up. My tactics do not always work and the numbers don't lie. So if something has affected my site negatively I can undo my changes and see if my numbers improve.
Analytics allows for me to compare how different versions of my website are doing against each other. I can then compare small or large changes and see if it affects traffic in any way. How about seeing what version of your site works better for different geographical regions? These are just some of the reasons I love and live by Analytics. I really could not see doing ANY of this without my statistics. It would be like trying to drive while blindfolded. Sure you might get where you are going but is it the best way to do things? Probably not and it is almost certain to get you into a car crash!
So to be a "Safe Driver" in the internet world you should watch your stats, trends and referrals so you can anticipate and make educated decisions.
Google Analytics does have one drawback and that is how often it is updated. Google does not allow us to see real time stats so if you want to watch those hits coming in you need another service. For this I have a second analytics account with http://www.statcounter.com this allows me to stalk my traffic and see in real time where people are going and what they are doing on my website as a direct result of some changes.
![]() How Do You Use Analytics Tools To Enhance Sales/Marketing? by Zack Miller
How Do You Use Analytics Tools To Enhance Sales/Marketing? by Zack Miller
Friday, May 30th, 2008 @ 2:42AM
Analytics are playing an increasingly greater role in running businesses both online and off. What started out as basic tools have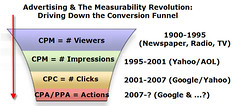 emerged as strategic advantages in greasing the wheels of commerce. We've witnessed companies like Google and Ebay/PayPal introduce analytics almost as add-ons to their core businesses. Now, we're seeing that these analytics are the business -- both Google's and their clients'. If Google and Ebay make me more effective in building my business, they are going to see more incremental ad dollars from my wallet.
While I'd like to say that my business (investment advice, premium investment newsletter) is driving by analytics, I think I am just at the beginning of using analytics to grow my business. This graphic shows how the evolution of advertising and analytics has occured.

I think analytics play a role in 3 distinct ways:
![]() How Do You Use Analytics Tools To Enhance Sales/Marketing? by Michael Munroe
How Do You Use Analytics Tools To Enhance Sales/Marketing? by Michael Munroe
Sunday, June 1st, 2008 @ 9:32PM
What Malcom Gladwell talked about - How Howard Moskowitz introduced multimodality into food science is something that could have been discussed by mathematicians in the 1940's. The ideas of Kolmogorov, or Bayes have been around much longer than prego or ragu. One huge problem is that mathematicians do not speak the same language as normal humans, and by most accounts they have little intention of ever doing so. A savvy business-person can get very quickly lost in the jargon. There are amazing, and effective, methods available for data analysis but they can not be easily translated from the language of mathematicians to the language of business-people. (http://en.wikipedia.org/wiki/Andrey_Kolmogorov, http://en.wikipedia.org/wiki/Expectation-maximization_algorithm#Example:_Gaussia n_Mixture)
Using the "Expectation Maximization" with a "Gaussian Mixture Model" it is possible to determine the optimal number of clusters, the location of their center, and their geometry. This mathematic tool is beautifully discussed in a book which should have been titled "applied statistical modeling" but was instead called "Neural Networks for Pattern Recognition" by Bishop in 1995, chapter 2, figures 2.14 - 2.17. The autonlab tutorials (http://www.autonlab.org/tutorials/l) by Andrew Moore (currently employed by google), are a good traversal of current (up to may 2007) content in Statistical Data Mining.
So there are methods to pry apart the data, but the results are still in the language of the mathematician. The ideas for how to gather the data, at best, come from design of experiements and at worst come from some misunderstood intuition. It is possible to have a great analytic method that you feed poor data to, and get results you dont know how to properly understand coming out of it.
I think that there is a significant library of existing effective methods for understanding your data, for asking the right questions, and get great answers, and under standing what the answers mean in relevant and insightful ways. I think that until business people are cross-bred with mathematicians and a quality hybrid (one that speaks both languages fluently) is born that the methods will continue to be under-utilized, and the results will cause the businesses to fail to grow.
So get dual majors in applied statistics and business, and have them use these great libraries of methods to do your analytics. There it is. Its not an engaging story, something entrertaining that tells you something human about the business of business. It is a solid method for someone in business to get a 20 year jump on what the competitors are doing by making or finding people that master the analytic science, but also master the art of business. Im assuming you know the business, and if you use the references in this paper you can have some idea of the sciences they need to have mastered. You can get an institute of higher learning to certify mastery in the techniques. Some math people are able to learn other less mathy languages if given a financial incentive - you might consider that. Good Luck.
![]() How Do You Use Analytics Tools To Enhance Sales/Marketing? by Bill Burke
How Do You Use Analytics Tools To Enhance Sales/Marketing? by Bill Burke
Monday, June 2nd, 2008 @ 12:39PM
.
Albeit old-fashioned to a point, I find relationship selling still a very valuable tool.
I try to keep detailed records of conversations, including quotes from the decision-makers
indicating their "hot buttons", the names of their admins, I always try to elicit at least one chuckle
and always preface either cold calls or 1st follow-ups with the promise: "I'll be brief".
I make a point to ask what times during the day are best for me to call back (when they're
most likely to be the least busy); and often let them hear me type or write down important
points or contententions they may have, to let them know not only am I paying attention to them,
but that I'm also paying close attention to what they want or need, via their priorities.
I think it's important that when an admin announces my call, the customer/decision-maker's
first though is "Oh yeah! That guy.. He's easy to talk to, he listens well and he gets right to
the point.. Yep! Let me talk to him!"
.
![]() How Do You Use Analytics Tools To Enhance Sales/Marketing? by Rick Frauton
How Do You Use Analytics Tools To Enhance Sales/Marketing? by Rick Frauton
Monday, June 2nd, 2008 @ 1:06PM
The most obvious application of web (and now mobile-web) analytics is to gain visibility into the sales conversion funnel. I have been working as a marketing consultant to various mobile content publishers and aggregators for the past few years. In most cases, the product I am commissioned to distribute is free to end-users, so I use the term 'sales funnel' loosely. Regardless of whether a monetary transaction is involved, there will always be a chain of events that lead up to a goal (or not). As a web marketing expert, it is my duty to understand every link in this chain -- something that requires the use of analytics tools.
One startup company I have consulted for in the past faced the challenge of acquiring users for a free mobile-device application. The first step to getting people to download this application was bringing them to the company website with an advertisement. In this case, I used Google's AdWords pay-per-click (PPC) web advertising system. I wrote a short text-ad like "Download this cool app!" and sent it out to the universe. The next day I logged into Google's AdWords reporting tool to find that my ad had been served to 15,000 potential customers, and 350 people clicked on the ad. My AdWords dashboard reported the ratio of clicks to ad impressions (click-through rate or CTR) as a percentage, in this case 2.33%. I was not satisfied with this CTR given the large volume of users I had to acquire, so I decided to change the wording of the ad to "Download this free app!". The following day I could see that the CTR had risen to 4.18% and deduced that the word "free" is particularly enticing to people. Who would have guessed? ;-) Thanks to the AdWords dashboard, I made a well-informed decision to keep using the word 'free' in my ad and thereby bring more visitors to the company website. This is the first example of how analytics reporting improved the performance of my client's business.
The second step was to use the website to convert visitors into registered users. Like most web companies, the website served as the storefront and sales staff. Therefore it is of utmost importance that each visitor to the website becomes engaged and makes it to the next page, or the next step in our conversion funnel. At this time the website had four pages, or steps, between the entry page (aka landing page) and the download page, which is the final step in the funnel. Using Google's free Analytics tool, I measured the path of each visitor to the site. After a week of monitoring site traffic, it became clear that the site was converting a meager 4% of visitors to registered users. Drilling in further to the analytics report I could see that 65% of visitors to the landing page continued on to the second step, but only 18% made it to the download page (third step) and only 7% attempted to download the application. Using this information, I decided to change the website to combine steps two and three on a single page. After doing so the percentage of users who reached the download page increaded to 25% and the overall visitors-to-registered-users conversion rate increased to 9% -- more than double the previous conversion rate!
In sum, operating a web business without applying knowledge gained from analytics tools is like trying to operate a retail store with no lights on.
![]() How Do You Use Analytics Tools To Enhance Sales/Marketing? by Eric Priezkalns
How Do You Use Analytics Tools To Enhance Sales/Marketing? by Eric Priezkalns
Monday, June 2nd, 2008 @ 5:55PM
Analytics cannot tell you how people in general will behave in the future, but it does tell you how your customers have behaved in the past. Businesses spend a great deal of money on market research. Even so, many mistakes are made, not least because of the risks of sampling error, of asking the wrong questions, or because there will be factors in real life that may not be anticipated. In contrast, the current customer based will often provide a larger population than any that could possibly be assembled through another kind of research exercise, and will also permit insights to be drawn over a much longer period time. Current customers are an authentic representation of real life. To effectively exploit this valuable resource of information, you need two things. First you need the ability to collect, store, mine and analyze the data. Then you need to know what questions to ask.
A business may possess a lot of data, but data is not the same as information. For data to become information, there has to be a use. Knowing that families have 2.6 children on average is not useful, because no family has 2.6 children. By the same token, inferences about "most" people, the "average" and all that are probably just convenient fictions. They make it easier to think of how large numbers behave, without really understanding how each and everyone in that large number is actually behaving. Successful analytics involves drawing conclusions from actual individuals, by cutting the data based on theories of how to group individuals into coherent groups that tend to behave the same way. This makes marketing both personal and relevant.
One of the most effective uses of analytics is to tailor prices and promotions to drive increased sales and improved margins. Provide a selection of customers with a better rate than normal, and see if the increase in sales justifies the lower price. Loyalty cards or vouchers are one way of associating promotions with customers, so future promotions can be targetted at the customers that are most responsive. This will enable the business to segment its customer base according to the different utility curves of different customers, and hence refine its pricing strategy and offerings accordingly.
Analytics can be used to assess the relative profitability of competitor's pricing schemes and incentive programs, or to perform hypothetical what-if analyses of proposed new prices and incentives. Particularly where there is highly stratified pricing, with rates decreasing as consumption increases, comparing new prices and pricing points to current customer behaviour will help to understand the potential for revenue growth or cannibalization depending on customers opt to buy more or less. Overlaying the volumes of sales per individual customers with competitor's pricing will identify which customers would be better off if they switched to competitors, and which customers are benefitting from the best available deal at present. This may help with identifying price reductions which would draw price sensitive customers away from competitors, and also price rises which would still better the offers made by rivals.
Adding data on cost of sales changes the focus from revenues to margins and profits. In a similar way, it is possible to include data on the timing of cashflows, say from bulk purchases or advanced bookings, to gauge how these can be improved through understanding the segmentation of the customer base. Any numerical data on costs and revenues that can be associated with individual products/services and with individual customers can provide a rich basis for comparison to competitors and pre-assessing the impact of proposed changes to prices and offers.
Customers that superficially seem profitable may be viewed differently once all costs are taken into consideration. Time spent handling customer complaints, or a track record of returning goods, may indicate the customer is more costly to serve and less desirable than originally thought. When identifying which customers to offer loyalty benefits to, it is worth directing these benefits to customers that are cheapest to serve by virtue of the smaller demands they place on the business. For example, there may be incentives for customers to purchase on-line because of the lower cost of taking the order compared to processing a sales order through a call center or in a store. It makes sense to extend that logic by and prioritizing customers that place a smaller burden on the business, for example because they submit orders in a way that consumes less staff time or because they raise fewer helpdesk or after-sales queries afterwards.
Revenues and costs are readily susceptible to analysis because they are numeric and because it is relatively simple to gather the necessary data and associate it with products and customers. In practice there are many ways to measure and segment customer behavior, and hence look for trends and groupings within the customer base. Geography may be a factor in sales and costs, thus enabling different strategies for different locales. Geography can be analyzed by either the customer's home address or per the different outlets. Demographic factors like age or cultural leanings may also provide a viable basis for analysis and segmentation. This kind of data might be obtained via credit checks or by asking customers to submit a survey.
What data will be relevant depends entirely on the product on offer and the nature of human behavior. Generalization from past experience may be useful, but will be misleading if nobody has considered some options for altering the offering or segmenting the customer base. No amount of data will assist in drawing useful conclusions if the wrong questions are asked. That takes the skill of the imaginative marketeer. But harness that insight to data and the power to perform analysis, and, like a scientist, the skilled marketeer can progress from forming a theory to being able to corroborate it in practice. This will lead to better decisions made with greater confidence and improved understanding of the results that are subsequently acheived. Imagination combined with data hence makes good business sense.
![]() How Do You Use Analytics Tools To Enhance Sales/Marketing? by David Cassel
How Do You Use Analytics Tools To Enhance Sales/Marketing? by David Cassel
Monday, June 2nd, 2008 @ 11:34PM
Recently Kaiser Permanente established a high-level customer analysis program that's revolutionary. They collect data about their health plan's 8.7 million members — as well as data from the 13,000 doctors who were treating them. Ultimately they're not just measuring customer satisfaction — but healthcare outcomes. They've compared the effectiveness of name-brand drugs to generics, and identified any doctors whose prescribing patterns stray from their guidelines. The program was so successful, they've created dozens of in-house analytic campaigns.
In a way, this is a unique animal — applying analytics not just to customer interactions, but to in-house behavior as well. But it achieved real and quantifiable benefits for Kaiser's largest customers — the big, cost-conscious employers purchasing health care plans "in bulk" for all their employees. Healthcare remains one of the most critical outlets for "pure" analytics. (SAS is considered a standard in the industry when applying for FDA approval.) But this example also shows that it's possible to serve customers by performing an analysis that goes beyond the obvious measures of satisfaction.
Capitol One analyzes the behavior of canceling customers — and generates a remarkably predictive model for which credit card offers will induce them to stay. But security expert Bruce Schneier recently noted that credit card companies also display a remarkable new level of precision when searching for fraud. Once a thief was identified after exactly two transactions — purchasing gas, and then making an expensive purchase at a department store. (Schneier's concern was the inability to recreate this precision in the hunt for terrorists.)
America Online embodies the best and worst in CRM — but give them credit for some very good business analytics. In one conference call, AOL's CEO bragged that they'd determined that "In many cases, 20 percent of the people decide not to cancel after talking to us." AOL began requiring all canceling subscribers to talk to a live operator — all of whom received a bonus if they talked the customer into staying. At the time AOL's Vice President of member services even acknowledged to the Wall Street Journal that they'd disabled an alternate path for canceling accounts online because they discovered "our cancellation rate was going up considerably!"
I've also had a small personal experience with business analytics at theweb site I started with two other writers. We constantly monitored our access log with complicated homegrown programs, including one issuing alerts when a story was submitted to Digg or Reddit. (Besides the potential for high traffic, these sites regularly threatened to overload our server, and we coordinated with our ISP to accommodate huge sudden spikes in traffic.) We identified 75 high-traffic sites which were referring the most traffic and which content they seemed to prefer. Establishing this "rolodex" pinpointed exactly where we need to promote our future articles. This ultimately kept our traffic high, helping us retain our advertisers and our cash flow.
But the most important piece of analytics turned out to be identifying flaws in your analytics. Eventually we discovered our host's analytics program was double-counting every pageview. We'd tried crunching statistics with a homegrown script — but soon discovered it was seeing an invisible audience of search engine spiders (some of which re-visited each page every couple of hours). We discovered heated debates online over how to answer what should be a fairly simple question — "How many real people are actually viewing these web pages?" Unfortunately, four different analytics packages provided four different answers. In the end we settled on Google Analytics — despite arguments that it undercounts browsers without JavaScript or cookies. The perfect answer simply wasn't available.
But at least we'd learned that business analytics can show you when you don't have the information you need.
|
David Cassel Mon Jun 2 11:42pm |
By the way, I probably should've identified my connection to these anecdotes. I worked at Kaiser Permanente for two years, was on the other end of AOL's conference call, and helped with Bruce Schneier's interview where he discussed credit card company analytics. |
![]() How Do You Use Analytics Tools To Enhance Sales/Marketing? by Joseph Hunkins
How Do You Use Analytics Tools To Enhance Sales/Marketing? by Joseph Hunkins
Monday, June 2nd, 2008 @ 11:46PM
As Gladwell noted in the Moscowitz story about observing the behavior of consumers, insight can come long after the data collection process, so I would say that a caveat to counting on CRM is making sure you also work to think out of the box, looking for new, valuable relationships (e.g. chunky sauces) within the data.
My own experience with online analytics tools mostly relates to the use of Google products including Google adsense metrics and Google Analytics - formerly Urchin - a fairly robust tool to measure website metrics such as unique visitors, inbound traffic sources, and search strings. Our use of the adsense analytical tools from Google give a variery of online performance measures relating to the performance of online advertising run by website publishers.
As a large site publishing travel a lot of "long tail" information we initially found that we could outperform Google's own "mediabot" which determined the best advertising for a given web page. We did this by simply requesting advertising that matched our page title. For example a page about "Peoria Illinois" would request advertising for "peoria illinois" rather than the Google defaults which would vary depending on complex metrics from Google that we did not have access to. It was never clear to us why our simply solution gave us about twice the monetary performance of the Google solution and this advantage seemed to diminish over time. We now accept the Google default ads.
Our experiences with web metrics tools for site numbers have been more challenging. General public tools like Alexa, Compete, and (subscription based) Comscore tend to vary wildly and inconsistently. We have found Google Analytics to be the best solution for us, though several studies suggest it often misses the mark in terms of web traffic, perhaps due to server caching issues with inbound traffic.
Alexa is downright confusing, and many web metrics tools appear to be (in part) cleverly disguised ways to encourage subscriptions. At Web conference in Boston I spoke with an insider at Digg who confirmed my own suspicioun that Comscore's numbers were way out of line, and that Comscore was at least indirectly using this fact as an argument to get websites to subscribe to their services in an effort to "get things right".
Thanks to the Salesforce website I have listed CRM case studies below. Although these have been chosen to some extent as a promotion for Salesforce' CRM tools, they offer great insights into the types of advantages a business can attain using a proactive approach to CRM analytics. Surprisingly I think most companies don't push management nearly hard enough to require more innovation in this space, where costs of traditional approaches remain very high and the benefits of better customer management are very great.
Here's a list of most of the case studies using SalesForce CRM tools. I have only briefly summarized some of these.
Ryder
Ryder basically was using an offline system with Microsoft Access and Excel spreadsheets to track contracts and leads. They automated the process of capturing and routing online leads leading to better quality and a 100% increase in volume of leads.
Travelex currency exchange used a new CRM to consolidate customer information across a whopping 100 countries, in perhaps the best example available of how CRM can very effectively be used to bridge national and language barriers and provide real time, round the clock capabilities that span the globe. By having the sales forces in different countries use the same system many of the language challenges are minimized, making global reporting much simpler and more accuratel
NJ TRANSIT oversees New Jersy's bus, rail and light-rail routes which carry 250 million passengers each year over three billion passenger miles. With $729 million in revenue this is a very big transit system. The CRM improved inquiry handling times and allowed processing of 42,000 inquires in 2006, up 500% from 2004 (not sure what they did with all the unhandled inquiries in 2004?). A great example of improving Government effeciency with CRM across a large transportation enterprise.
Cars.com used integrated CRM for support agent improvements: six cases per hour to nine cases per hour.
Customer support team improved by from 600 dealers per agent to a peak of 800 dealers per agent. Also cut response times by more than 65 percent, beat existing SLAs by over 50 percent
Time Warner Cable Business Class
Time Warner Cable is a good example of using CRM to organize oceans of existing data into coherent, actionable information. The CRM system replaced *two* employees at the firm, and led to improved data interpretation and organization about customers and trends.
Symantec
When Symantec and Veritas merged they changed CRM systems and used the new system to quickly integrate two large customer systems.
Tyco needed to integrate their CRM across 22 countries with seven languages. This is a superb example of how the language barrier can be overcome with a quality CRM integration, leading to much easier analysis, action, and effeciency across a global enterprise.
Blackberry Synchronization for sales team with outlook email, custom dashboards. Mobile enable the workforce with critical customer data.
Reference Links:
http://searchcrm.techtarget.com/news/article/0,289142,sid11_gci1226481,00. html
http://www.salesforce.com/customers/
